Understanding your features
You are already provided pre-processed features with the Iris dataset, rather than raw features. Therefore, there is no need for an explicit feature encoding step. We can just use the pre-processed featuers directly.
Now that we have examined the classes, let us now specifically try to examine and understand the features themselves.
So far, we have figured out that there are four features. But…
Question 1: What does each feature represent?
Scikit-learn gives you that information, with an attribute aptly called .feature_names.
feature_names = dataset.feature_names
print(feature_names)
You should get four features:
- sepal length (cm)
- sepal width (cm)
- petal length (cm)
- petal width (cm)
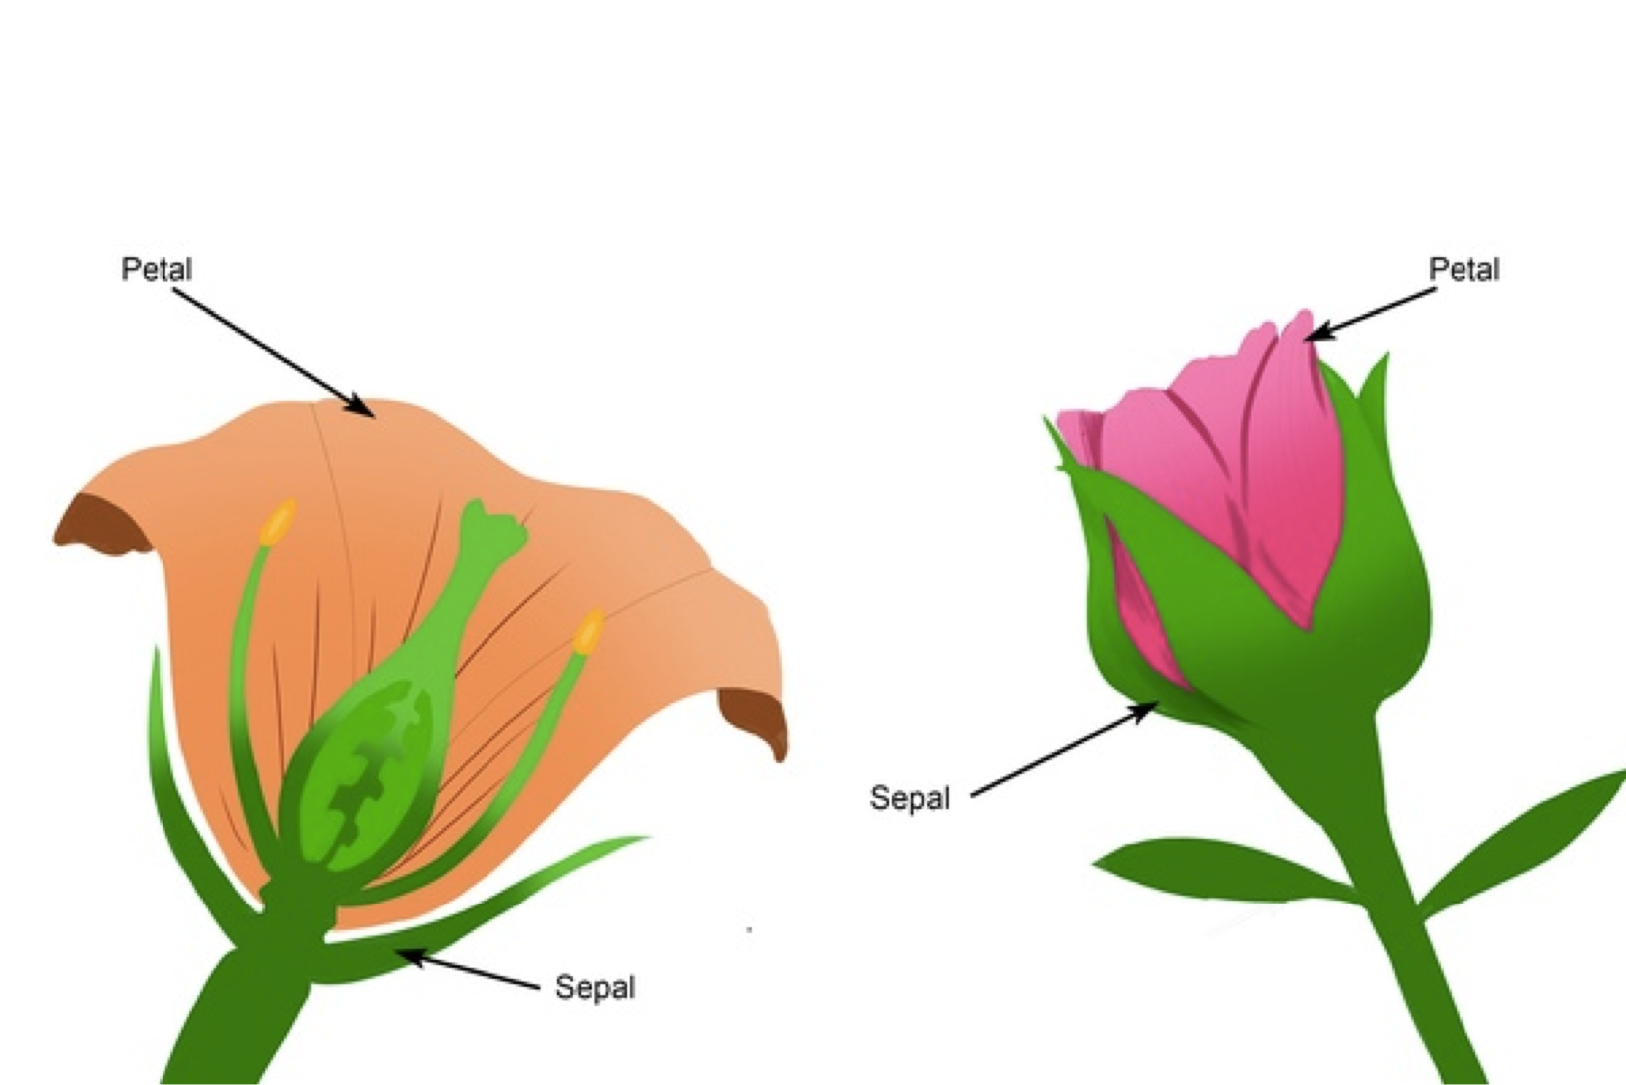
If you are botanically challenged like me, then here is a diagram of what sepals and petals are:

Question 2: What is the type of the features?
The next thing you should try to figure out is what the data type of each feature is. Are they integers? Floats? Categorical? Strings?
You can of course check the internal NumPy datatype of x easily.
print(x.dtype)
You should, however, also check whether any of the features are actually not floats, but are just cast as floats for convenience. For example, some of these features may actually be integers represented as floats. If this happens, then it will be your design decision on what to do with these (it’s usually fine to keep them as floats). For the Iris dataset, these are all genuinely floats, so there is nothing to worry about.
Question 3: What is the range of each attribute? And mean/median/standard deviation?
The next item you can do to understand the features better is to get some statistics on them.
For example, what is the minimum and maximum values for each feature/attribute? What is the mean, median and standard deviation for each? This will help you understand your features better.
You can use NumPy to compute this. I will not give you the solutions to this, but will let you practise your NumPy skills here. Check out the NumPy tutorials if you need a refresher.
Question 4: What are the range and statistics of each attribute, per class?
Again, it is also a good idea to obtain the statistics above separately for each class. So you can try to find each attribute’s range/mean/median/standard deviation separately for class 0, class 1 and class 2. You may discover some patterns and get some ideas about what features will be useful for certain classes.
Try this yourself?
Hint: x[y==2] will give you all feature vectors that belong to class 2.