Lesson 6
Dealing with Sequences of Objects
Chapter 9: Testing and debugging
Debugging using breakpoints
Let us now talk about debugging.
So far, you have mostly debugged your programs using the print() method to print out the values of objects/variables.
Sometimes, your program may be complicated, and you will have to examine the values of many variables. Using the crude print() method to print out the values of all the variables might be a bit of a hassle.
Fortunately, Python comes with its own debugger called pdb (Python debugger). It allows you to run a program in debugging mode, where you can pause at certain lines to examine the values of your variables, and continue executing the program, and stopping where needed.
One simple way of using the debugger is to set up breakpoints in your code. When you run your program, Python will pause your program at these breakpoints so that you can inspect the current values of variables, etc. You can easily add breakpoints to your program with the breakpoint() function.
For example, say your program below resulted in an infinite loop. I’ve added breakpoint() in Line 3 and saved the program below as debug.py.
1 2 3 4 5 6 7 | |
When I run the program in Python (python debug.py), Python will pause at the breakpoint and run the debugger.
> ~/debug.py(4)<module>()
-> num = 10 + total
(Pdb)
Here Python has stopped at the breakpoint, and is about to run line 4 (the parenthesis (4) is the line number ~/debug.py(4)<module>(), which is num = 10 + total). You can at this point inspect the value of total by typing it into the debugger.
(Pdb) total
1
num has not yet been defined (you have not run Line 4 yet), so the debugger will not have any information about that variable.
(Pdb) num
*** NameError: name 'num' is not defined
To resume the program until the next breakpoint, type cont into the debugger. You will be back at the top of the loop on Line 3.
(Pdb) cont
> ~/debug.py(3)<module>()
-> breakpoint()
Inspect your variables again.
(Pdb) num
11
(Pdb) total
12
You will have figured out that your total is now > 10, and if you continue adding more to it you will definitely be stuck in an infinite loop. Seems like you will have to rethink your algorithm!
Play around with the debugger yourself to get a feel of it. Once you are done debugging, you can exit the debugger with exit.
(Pdb) exit
You can also learn more about what other commands are available by typing h or help into the debugger.
(Pdb) help

Documented commands (type help <topic>):
========================================
EOF    c          d        h         list      q        rv
...

(Pdb) help n
n(ext)
        Continue execution until the next line in the current function
        is reached or it returns.
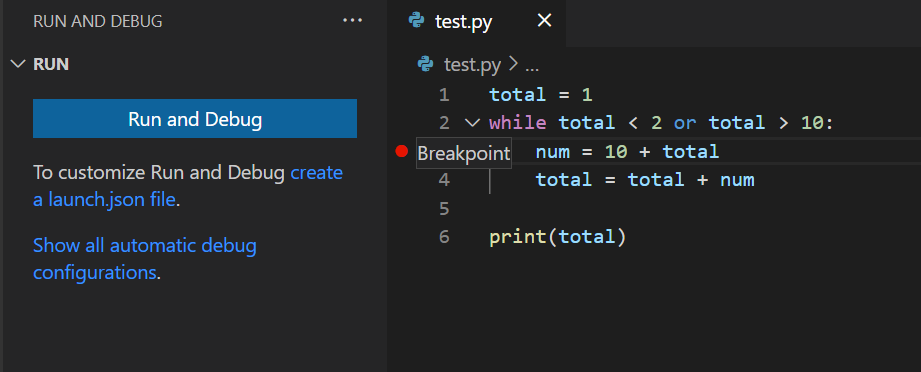
Using breakpoints and the debugger becomes easier when/if you start using an IDE in the future. You usually only need to click next to the line number to insert a breakpoint (red circle in the screenshot below) and run the debugger with the IDE to examine the results of any variables.

Of course, it is always important to understand what actually goes on in the background before using any tool in an IDE!
